In this lesson we will study how to use Matplotlib plot to draw graphs. The plot() function is in fact used to draw various types of graphs. Throughout the tutorial we will see various practical examples.
Let’s draw a graph with Matplotlib Plot function
So let’s start with some examples to understand how the plot() function works and its fields of application.
First we draw a simple line, passing to plot() a list of numbers, a simple array of 3 numbers:
import matplotlib.pyplot as plt

plt.plot([5,10,15])
plt.show()
In this way the values indicated in square brackets represent the values of y, while the values of x will be assumed by default equal to 0,1,2,3.
This means that, in our case, we will have these coordinates (0,5), (1,10), (2,15).
Then, thanks to plt.show() we display the resulting graph. Try it in the online compiler:
Example of a chart with the plot function of Matplotlib
Let’s draw another simple graph. This time we pass the following values to the plot () function: [x1, x2], [y1, y2]. That is, the starting and ending point of x and the starting and ending point of y:
import matplotlib.pyplot as plt

plt.plot([1,2],[4,8])
plt.show()
Another example of a chart with the Matplotlib plot function
Let’s try to draw a broken line, defining the values of the x and y axis, as arrays. After we pass these values to the plot() function, finally we always use the show() function to show the resulting graph.
Here is the sample code:
import matplotlib.pyplot as plt

x = [1,5,3]
y = [3,6,9]

plt.plot(x,y)
plt.show()
NumPy e Matplotlib
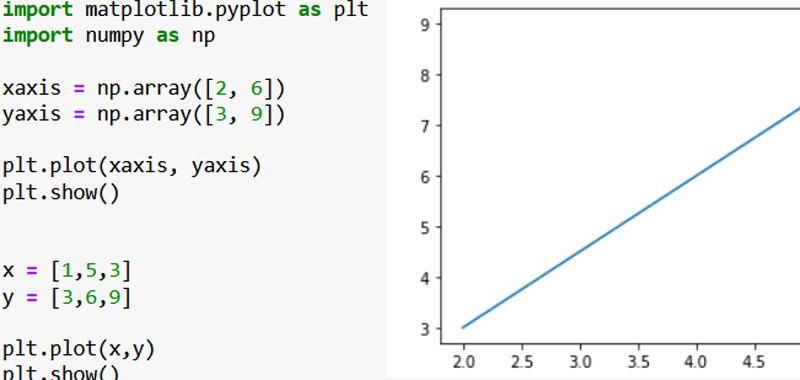
In this example we use the NumPy library to create arrays. Then we pass the arrays to the plot() function. Finally we visualize the graph thus obtained.
import matplotlib.pyplot as plt
import numpy as np

xaxis = np.array([2, 6])
yaxis = np.array([3, 9])

plt.plot(xaxis, yaxis)
plt.show()
Ultimately it is like passing the pair of values (2,3), (6,9).
In this lesson we have only seen some basic examples of Matplotlib plot() function, in the next lessons we will have the opportunity to deepen with many other examples, customizing the graphs with markers, linestyle, label, title, etc …

